
 Associated Press Elections
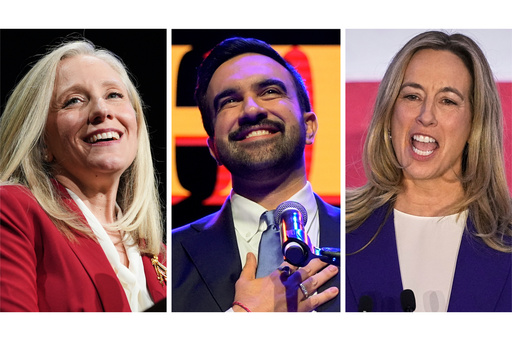
WASHINGTON (AP) — Democratic candidates saw victories across key races Tuesday, and there were signs there’s plenty of room for the Democratic Party to make up ground among groups that moved toward President Donald Trump in the 2024 election.
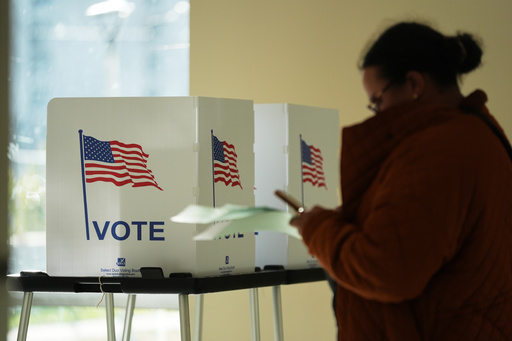
That finding comes from the AP Voter Poll, a sweeping survey of more than 17,000 voters in New Jersey, Virginia, California and New York City that explains who voted in each election and their views on top issues in their state.
Even with major wins, the survey also exposed fault lines for Democrats. Young men were less likely than young women to support Democrats in the governor’s races, and Jewish voters in New York City appeared wary of supporting Democratic nominee, Zohran Mamdani.
Here’s a look at how key demographic groups in 2025 voted, according to the AP Voter Poll.
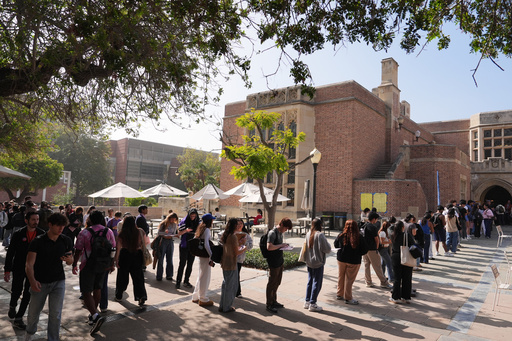
Mamdani, 34, will be the city’s youngest mayor in over a century. Young voters in New York City overwhelmingly backed him in his generational showdown with former Gov. Andrew Cuomo, who ran as an independent, and Republican Curtis Sliwa.
About three-quarters of New York City voters under 30 cast a ballot for Mamdani. They were a relatively small portion of the city’s electorate, and they also were much more likely than older voters to say it was their first time voting in a mayoral election.
Older voters were more likely to back Cuomo than Mamdani, but a significant share still backed the Democratic nominee. About 2 in 10 Mamdani voters were under 30, while voters for Cuomo and Sliwa skewed much older.
Mamdani has identified as a democratic socialist throughout his campaign, following the brand of U.S. Sen. Bernie Sanders and U.S. Rep. Alexandria Ocasio-Cortez. About one-quarter of New York City voters said they identified as a democratic socialist, with about 4 in 10 voters in New York City under 30 saying they identify this way.
Democrats’ strong performances with non-white voters in New Jersey and Virginia were promising for the party, after Trump made inroads with Black and Hispanic voters in 2024.
About 7 in 10 voters in New Jersey were white, and Democratic gubernatorial candidate Mikie Sherrill won about half that group. But she made up for it with a strong showing among Black, Hispanic and Asian voters. The vast majority — about 9 in 10 — of Black voters supported Sherrill, as did about 8 in 10 Asian voters.
Hispanic voters in New Jersey were more divided, but about two-thirds supported Sherrill; only about 3 in 10 voted for the Republican nominee, Jack Ciattarelli.
The pattern was similar in Virginia, where Democrat Abigail Spanberger performed well among Black voters, Hispanic voters and Asian voters, even though she didn’t win a majority of white voters.
Mamdani will be New York’s first Muslim mayor, and he won the vast majority of Muslim voters. About 9 in 10 Muslim voters supported Mamdani, according to the AP Voter Poll. They made up a very small voter group in the city: about 4% of New York City voters were Muslim.
No other candidate had such uniform support from a religious group, but Cuomo claimed the support of about 6 in 10 Jewish voters, while only about 3 in 10 cast a ballot for Mamdani.
Jewish voters’ support for Cuomo was the culmination of months of anxiety and division within the country’s largest Jewish community, as many voters and leaders expressed concern about Mamdani’s harsh criticism of Israel.
About half of Jewish and Muslim voters in New York City said the candidates’ positions on Israel were “a major factor” in their vote.
Most voters under 30 voted for the Democratic candidates in the New Jersey and Virginia governor’s races, and the New York City mayoral campaign, but young women were particularly likely to support Democrats.
About 8 in 10 women under 30 supported Sherrill in New Jersey, compared to just over half of men under 30. That was similar in Virginia, where roughly 8 in 10 women under 30 voted for Spanberger and about 6 in 10 men under 30 did.
There were gender divides among older voters as well, but they weren’t as large. Just over half of women ages 65 and older, for instance, supported Sherill, compared to about 4 in 10 men ages 65 and older.
Disruptions to the federal workforce over the past year, including the ongoing government shutdown, were felt particularly in Virginia. About 2 in 10 Virginia voters said they live in a household with someone who is currently employed by the federal government or as a federal contractor, according to the poll.
Voters with a federal government worker in their household were likelier than other voters to support Spanberger. About two-thirds of voters who live in a household with a current federal employee or contractor voted for Spanberger, compared to just over half of voters in households without a family member who works for the government.
About 6 in 10 Virginia voters also reported that their family’s finances had been affected “a lot” or “a little” by federal government cuts this year. About two-thirds of those voters supported Spanberger, while about 6 in 10 voters who said they hadn’t been affected by the cuts supported Republican Lt. Gov. Winsome Earle-Sears.
Veteran households did not back Sherrill — but she won without their support.
Sherrill is a Navy veteran who faced questions surrounding a cheating scandal during her time at the U.S. Naval Academy. She won about 4 in 10 voters from a U.S. military household, while about 6 in 10 voters in veteran households voted for her opponent, Ciattarelli. Veteran households made up about one-quarter of voters in New Jersey.
Even more Virginia voters, roughly 4 in 10, said someone in their household had ever served in the U.S. military. Spanberger won about half of veteran households in Virginia.
___
The 2025 AP Voter Poll, conducted by SSRS from Oct. 22 to Nov. 4, includes representative samples of registered voters in California (4,490), New Jersey (4,244), New York City (4,304) and Virginia (4,215). The AP Voter Poll combines data collected from validated registered voters online and by telephone, with data collected in-person from election day voters at approximately 30 precincts per state or city, excluding California. Respondents can complete the poll in English or Spanish. The overall margin of sampling error for voters, accounting for design effect, is plus or minus 2.0 percentage points in California, 2.1 percentage points in New Jersey, 2.2 percentage points in New York City and 2.1 percentage points in Virginia.
 KTAR News 92.3
 Raw Story
 Local News in New Jersey
 AlterNet
 Political Wire